Project Information
Share:
AutoNation
Power BI
25 January, 2023
Phoenix, AZ, USA
About Project:
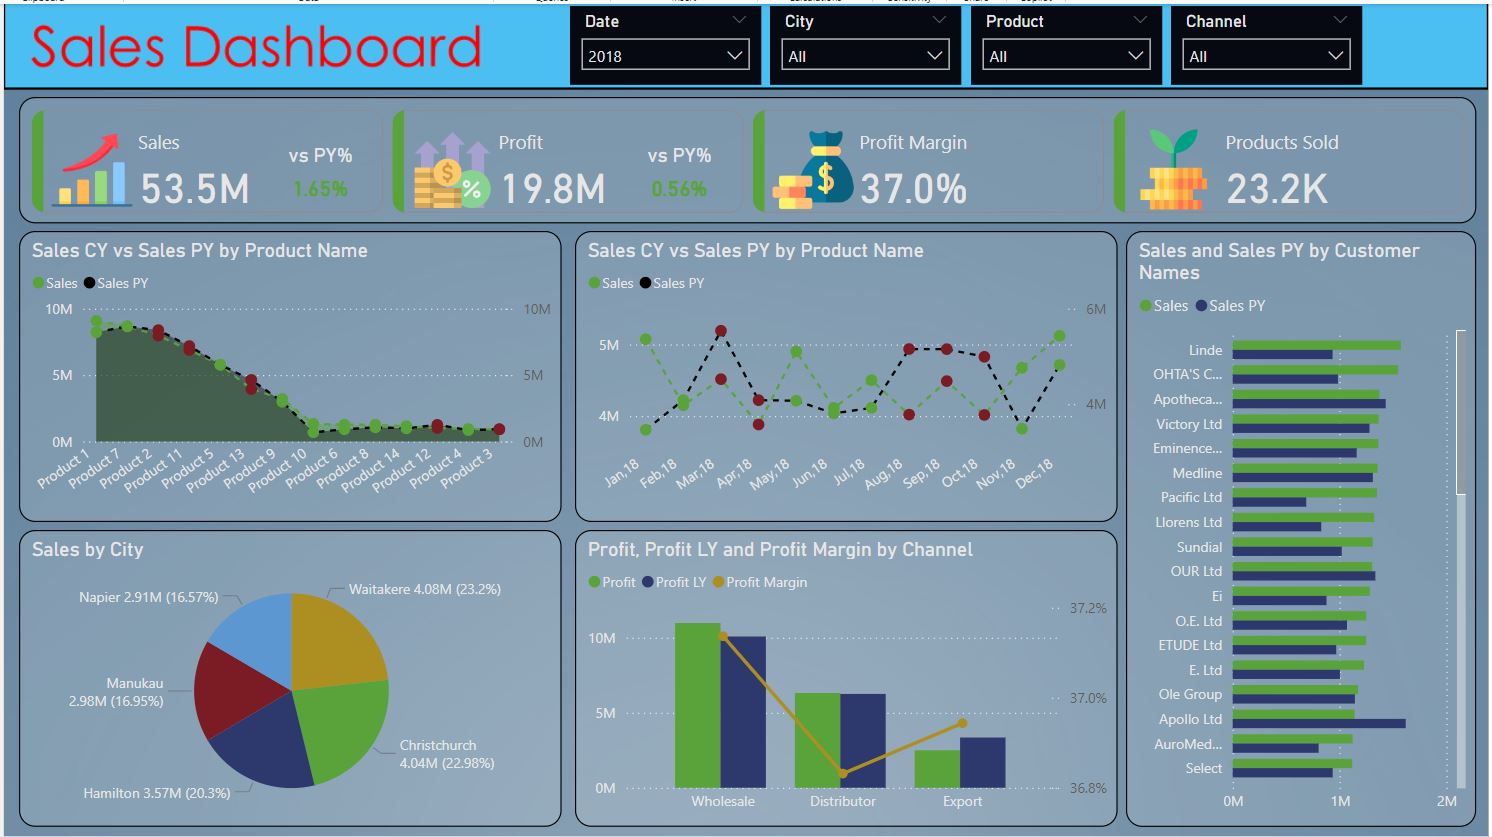
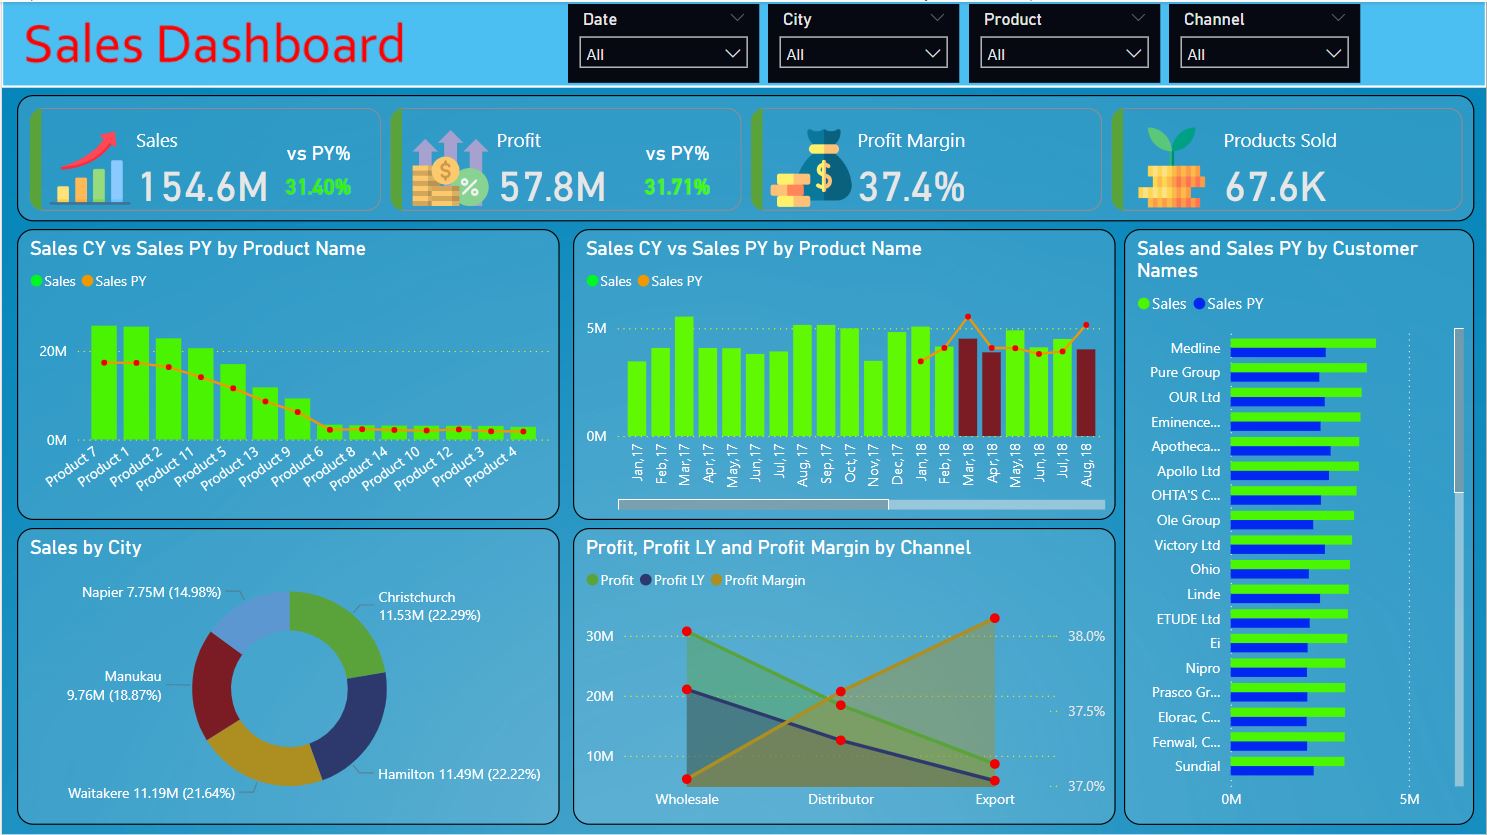
This Sales Management Power BI Dashboard is a complete analytics solution designed to provide business leaders and sales managers with real-time insights into sales performance. The dashboard presents an intuitive and interactive layout to monitor key metrics such as total sales, profit margins, customer segmentation, product performance, and city-based sales trends. A dynamic bar chart compares current year (CY) versus previous year (PY) sales by product, while a pie chart highlights the sales distribution across major cities. It also showcases operational metrics like profit variations by channel and individual customer sales behavior. With advanced filtering options by date, city, product, and sales channel, this dashboard enables data-driven decision-making to maximize sales strategies, optimize product focus, and drive profitability.
Transform Sales Data into Insights.
A robust Sales Management Dashboard in Power BI that visualizes essential sales metrics, product trends, customer patterns, and operational insights to empower strategic growth initiatives.
Interactive Visuals
Dynamic bar charts and pie charts illustrate product sales comparisons, customer distribution, and channel-based profitability.
Global Insights
Tracks sales operations across multiple cities and markets with powerful slicers for deeper filtering and performance analysis.
Customer-Focused Metrics
Highlights sales trends by customer name, tracks buying patterns, and compares year-on-year product performance to support better customer relationship management.