Project Information
Share:
Shoppers Drug Mart
Power BI
25 January, 2023
58 Danc Street, USA
About Project:
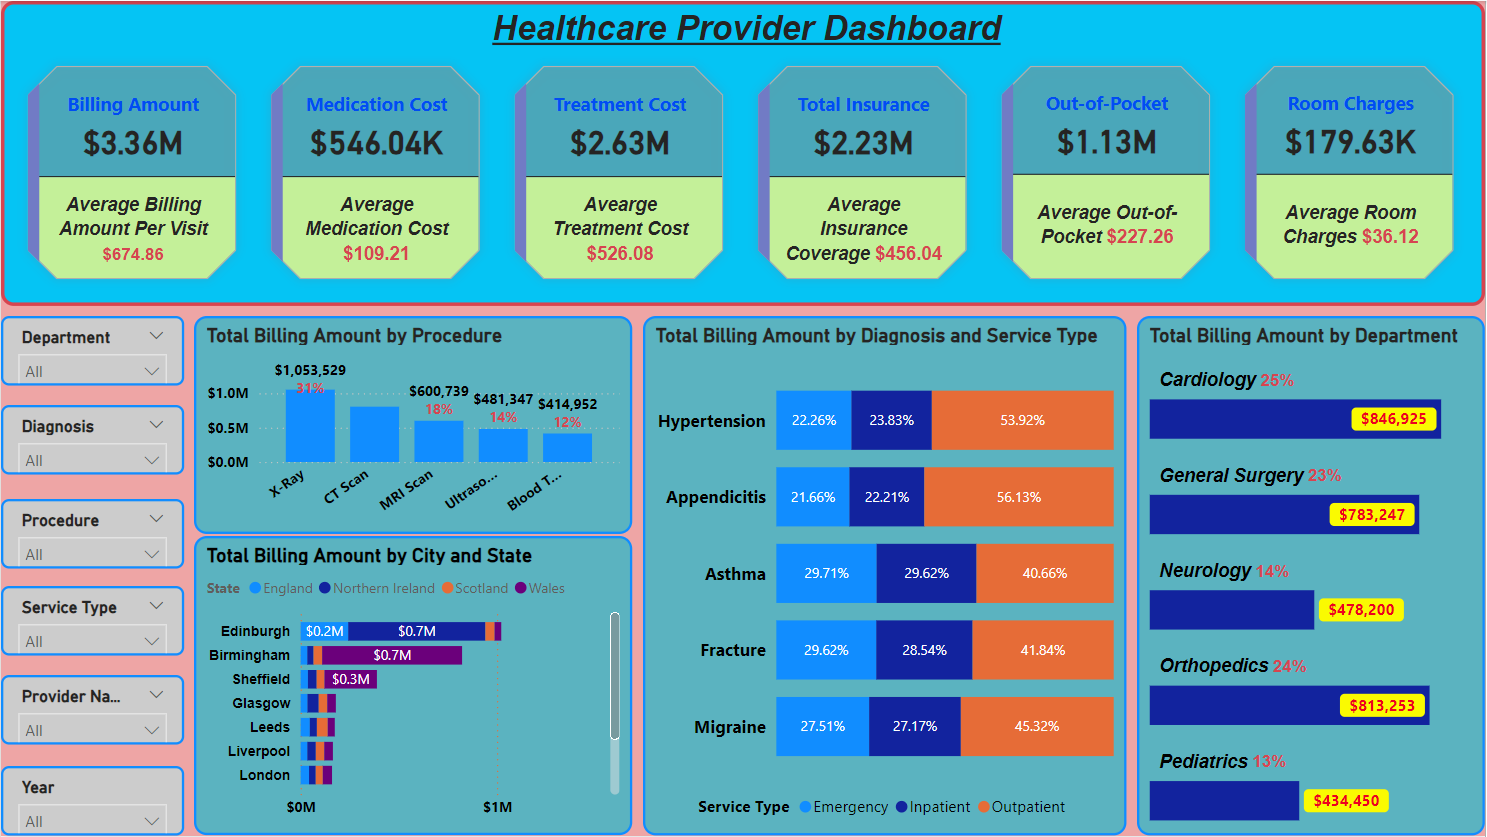
This Healthcare Provider Power BI Dashboard is a comprehensive analytics tool created to give healthcare administrators and decision-makers real-time insights into billing performance and operational efficiency. The dashboard delivers a clear and intuitive view of important metrics such as billing amount, medication costs, treatment expenses, insurance coverage, and out-of-pocket charges. It visualizes key breakdowns like total billing by procedure, diagnosis, and department, helping healthcare leaders optimize revenue cycles and service delivery. Interactive charts showcase billing trends across states and service types (emergency, inpatient, outpatient). With dynamic filters for department, diagnosis, provider, and year, this dashboard enables data-driven healthcare management, driving better financial performance and strategic resource planning.
Transform Healthcare Data into Insights.
An advanced Healthcare Billing Dashboard in Power BI that displays financial metrics, patient diagnosis patterns, department revenue trends, and service breakdowns to support operational excellence and informed healthcare leadership.
Interactive Visuals
Bar charts, stacked charts, and category breakdowns reveal billing amounts by procedure, diagnosis, and department in a clear, actionable format.
Global Insights
Tracks billing operations across major states and cities, offering detailed comparisons for better regional performance analysis.
Patient-Focused Metrics
Monitors healthcare service types, highlights billing costs for emergencies and inpatient visits, and provides average cost metrics for treatment and medication management.