
Project Information
Share:
Hertz Car Sales
Power BI
25 January, 2023
Toronto, Ontario
About Project:
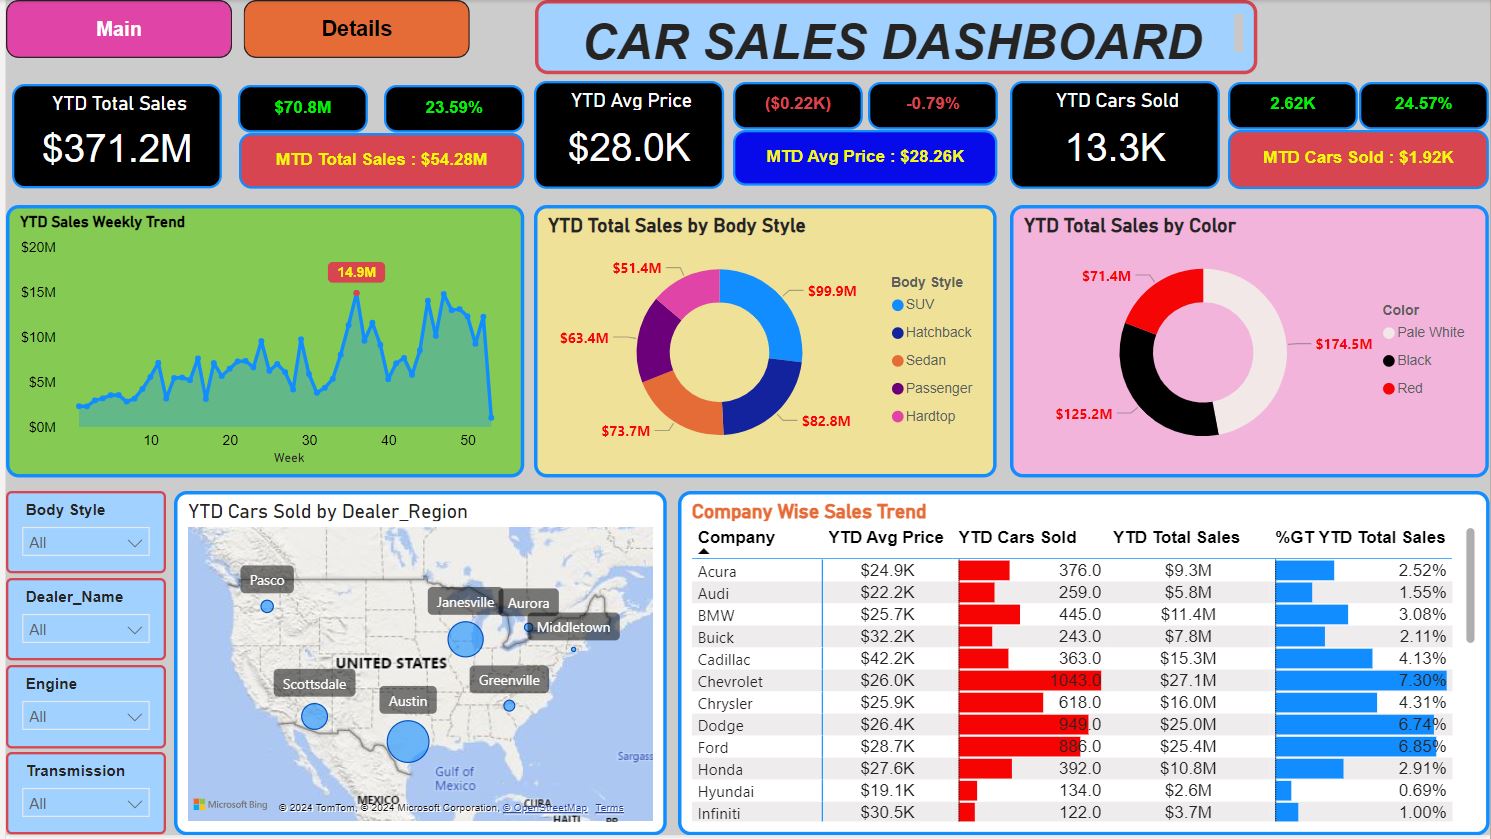
This Car Sales Power BI Dashboard is a complete analytics solution crafted to provide automotive managers and sales strategists with real-time insights into dealership performance. The dashboard offers a visually rich layout to track major KPIs such as total sales, average selling price, cars sold, and sales growth trends. Key visuals include YTD sales analysis by body style and color, weekly sales trends, and company-wise sales distribution. A dynamic map showcases regional sales performance across dealer locations. Equipped with filters for body style, dealer name, engine type, and transmission, this dashboard empowers teams to make informed decisions to optimize inventory, enhance marketing strategies, and drive higher car sales revenue.
Transform Automotive Data into Insights.
A powerful Car Sales Management Dashboard in Power BI that visualizes essential sales trends, regional performance, product segmentation, and dealership analysis to support strategic decision-making.
Interactive Visuals
Line charts, donut charts, and comparison tables bring clarity to sales trends by body style, color, and company performance.
Global Insights
Analyzes car sales across different dealer regions in the United States, offering detailed breakdowns for better geographic strategy.
Customer-Focused Metrics
Tracks sales preferences based on body style and color, monitors pricing patterns, and measures YTD sales growth to optimize dealer performance and inventory management.
